Scraping Tripadvisor Flights
View Demo AppContext
Ever wondered when the best time and date to book a flight is? Or how about which airlines really provide the best bang for your buck? As a casual flyer myself, I've pondered these same questions countless times without ever reaching a real conclusion that wasn't influenced by the last clickbait ad I saw on Twitter five minutes ago. Well, I finally said enough was enough and took matters into my own hands by shamelessly extracting nearly an entire calendar year's worth of flight deals on Tripadvisor. I say "nearly" because the Tripadvisor website did not flight deals available past December 21, 2020. Keep in mind that these deals were scraped in real time on January 27, 2020.
Methodology
Although I desperately wanted to use Scrapy Web Crawler for its relatively fast scraping rate, I resorted to Python's rather slow Selenium library package simply for the fact that it was able to scrape my desired site, Tripadvisor. Like most major corporations, Tripadvisor runs their site dynamically, allowing for cool features such as searching for flight deals based on lowest to highest prices or booking hotel rooms based on reviews and user ratings. Unfortunately, Scrapy is unable to handle sites that are configured this way.
As a result, I created a Selenium web driver that executed the following steps:
- Opened a Google Chrome web browser that navigated to Tripadvisor's Flights website
- Set starting departure date as January 27, 2020, origin airport as NYC (i.e. JFK, LGA, EWR), and first destination airport as LAX; submitted query
- Once results loaded, scrolled through every page of flight deals for NYC to LAX and exported valuable data from each deal (i.e. price, fly score, departure date, etc.) onto a CSV file
- Repeated previous step for the four remaining destination airports
- Once all five destinations for an entire day are scraped, the collection of flight deals for that day are written and stored in a CSV file
- Then, the scraper repeats the search process again with LAX as the first destination but with the departure date set to the next day, January 28th, 2020
- The scraper was interrupted and stopped when it reached December 22, 2020 since there were no flight deals available by Tripadvisor for that date and beyond
Overall, I was left with one CSV file per day of flights between 01/27/20 - 12/21/20. From these daily files, I concatenated them into 12 separate monthly files based on the month of the flight's departure date. Then, I combined the 12 monthly files into one single file with every row representing a flight deal and the following variables to describe each flight:
- Departure Date
- Departure Time
- Origin Airport Code
- Arrival Date
- Arrival Time
- Destination Airport Code
- Flight Duration (hours)
- Overnight Flight Designation
- Airline
- Flight Price
- Flight Rating (Fly Score)
- Day of the Week
The following analysis was performed using the twelve key variables listed above and a total of 57,801 individual flight deals.
Core Analysis
Though the bulk of my analysis was exploratory in nature, I extracted a handful of insights that are valuable to both casual flyers (those who fly at least once a year) and frequent flyers (those who fly at least once a month for business and/or leisure), as well as airline corporations. According to the trade organization Airlines for America, commercial aviation helps drive more than $1.5 trillion per year in U.S. economic activity and more than 11 million U.S. jobs. So, if people like us are going to keep flying but also continue searching for the best quality deals while the airline industry thinks of new ways to get us to purchase those same deals, I was left with one last question: are there any potential areas of compromise where both sides can essentially get what they want?
Before we reach that conclusion, let's build up our understanding of the flight data as a whole by exploring 3 key themes:
- Time & Seasonality
- Flight Prices
- Flight Ratings
Daily Flight Prices
First, let's take a look at the daily average price of flights over the entire dataset (approximately 10.5 months between 01/27/20 - 12/21/20) to five different cities including Los Angeles (LAX), Miami (MIA), Chicago (ORD), San Juan (SJU), Montreal (YUL).

Notice the rollercoaster-like pattern of the average projected flight prices mapped out over a year. The major price spikes happen to be aligned with the major federal U.S. holidays including Thanksgiving, Christmas, New Year's, Memorial Day, and my personal favorite the 4th of July. All of these holidays were confirmed as local price maximums in the data that I scraped as shown in the plot above. Since many people have paid time off during federal holidays and are looking to travel whether it be to escape the cold or visit relatives, significant flight price increases are expected. Interestingly enough, Valentine's Day weekend (not a federal holiday) was the most expensive time of year to travel out of NYC to any of the five destinations listed above. So, what are some possible factors or variables that might contribute to this Valentine's Day anomaly?
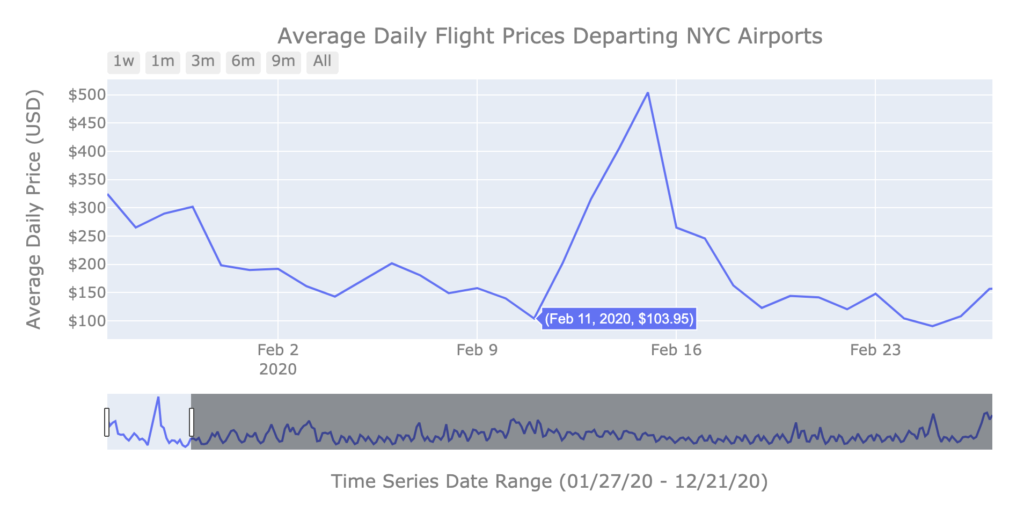
My evaluation is that the nearly $400 average daily price increase from February 11th ($103.95) to February 15th ($504.13) was most likely due to Valentine's Day falling on a Friday in 2020. Whether it was finally taking that couple's vacation to Miami or Puerto Rico, or visiting that long distance significant other out in L.A. or Chicago, I think Tripadvisor knew New Yorkers were more inclined to travel this year for Valentine's Day since it didn't fall on an "inconvenient" day such as a Tuesday or Wednesday. With the day falling on a weekend, couples had more leeway to plan memorable weekend getaways.
Essentially, airlines used this information to their advantage, hiking up prices leading up to, on, and immediately after Valentine's Day to maximize profits. Airlines anticipated the possible increase in demand for outgoing flights between February 11th and February 15th this year and adjusted their prices accordingly. Indeed, this is just one angle of approach to explain this data and in reality, there are a number of factors that might play into this specific price surge. With more time and resources, I think it would be valuable to conduct further research on other factors and circumstances that might explain airlines nearly quadrupling their prices during this five day stretch in mid-February.
Flight Prices By Month
Although looking at daily flight prices is helpful in understanding the overall behavior of the industry, as a consumer, I'm left thinking there aren't many practical insights or tips I can gain from this data. However, after manipulating the data to reflect average monthly prices as opposed to average daily prices, a few nuggets seem to shine.

Here, we're able to see that at the time this data was scraped in January 2020, September 2020 was projected to have the cheapest overall flights averaging a whopping $147 per flight. Keep in mind that this data included flights from NYC to both Montreal, Canada and San Juan, Puerto Rico. Meanwhile, June 2020 was projected to have the most expensive flights averaging about $204 per flight.
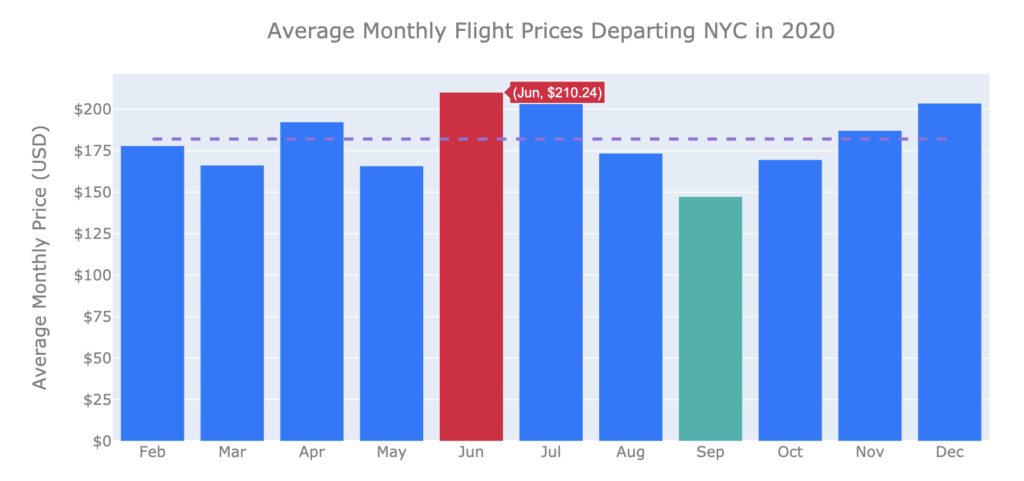
For bargain hunters, this information could be quite useful when planning their next vacation as they could potentially save an average of $57 per ticket by waiting an extra 3 months if their schedule and circumstances are flexible.
Flight Prices By Day of Week
Great, now we know which months to look into and which ones to avoid. So, which day of the week has the cheapest flights available? Well, if you happen to have a very flexible schedule and can pick any day of the week to fly, your best bet is booking a Tuesday flight as shown in the distribution below. To not get distracted by outliers, I limited the data to only show flights $500 and below.
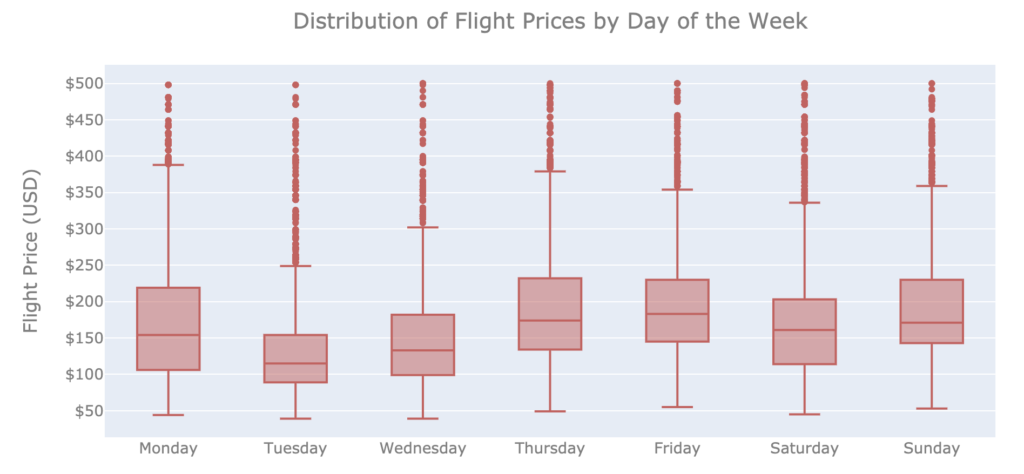
Out of all the days of the week, Tuesday has the lowest projected median price at $115 as well as the smallest range of prices.
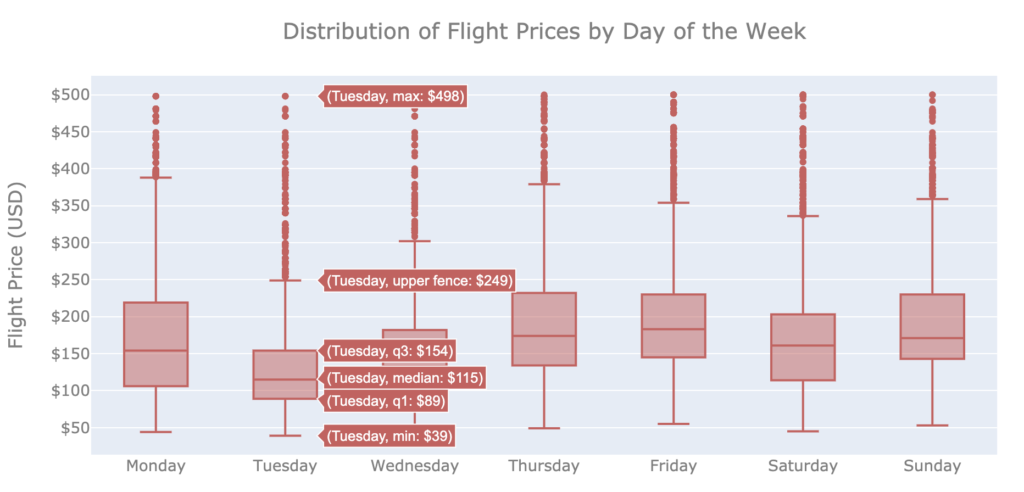
According to the distribution of prices shown above, 50% of flights available on Tuesdays were between $89 and $154, the first quartile and third quartile respectively. Wednesday had the next lowest median flight price at $132 followed by Monday with a median flight price of $154. Contrastingly, Fridays had the most expensive prices with a median flight price of $179 followed by Sundays at $171 and Thursdays at $169.
Flight Ratings By Day of Week
Similarly, the distribution of Fly Scores (ratings) for each day of the week only reinforces the conclusion that Tuesdays and Wednesday are the best days to book a flight.
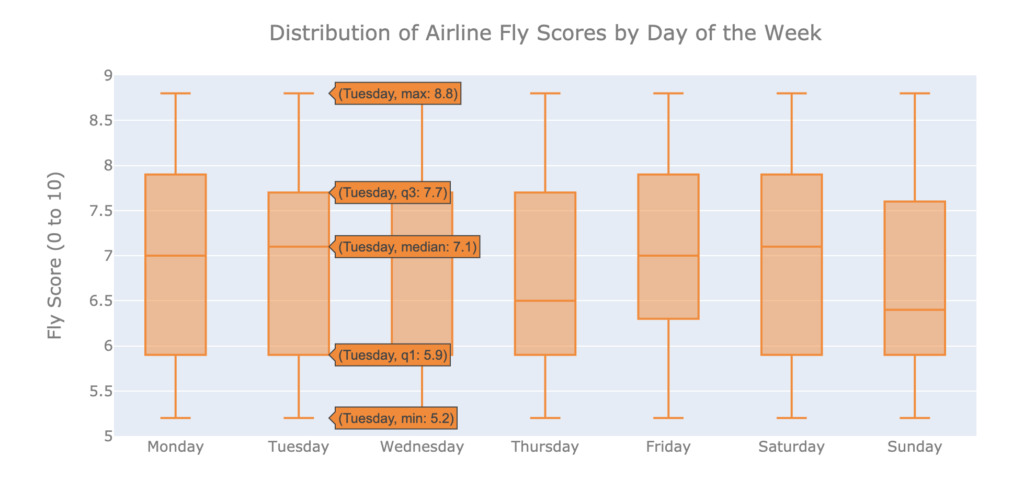
Indeed, Tuesday and Wednesday had almost identical distributions of fly scores with a median score of 7.1 and 50 percent of the scores falling between 5.9 and 7.7 points. Thus, it can be inferred that Tuesdays and Wednesdays are the best days of the week to fly because they have the lowest median prices and the highest median fly scores. Keep in mind that these findings are based on flight prices for days of the week over the entire year. Therefore, Tuesdays and Wednesdays are the best days of the week to book the cheapest flights with the best aggregate ratings regardless of what month it is.
Contrastingly, Thursdays and Sundays had the worst aggregate fly scores with median scores of 6.5 and 6.4 respectively.
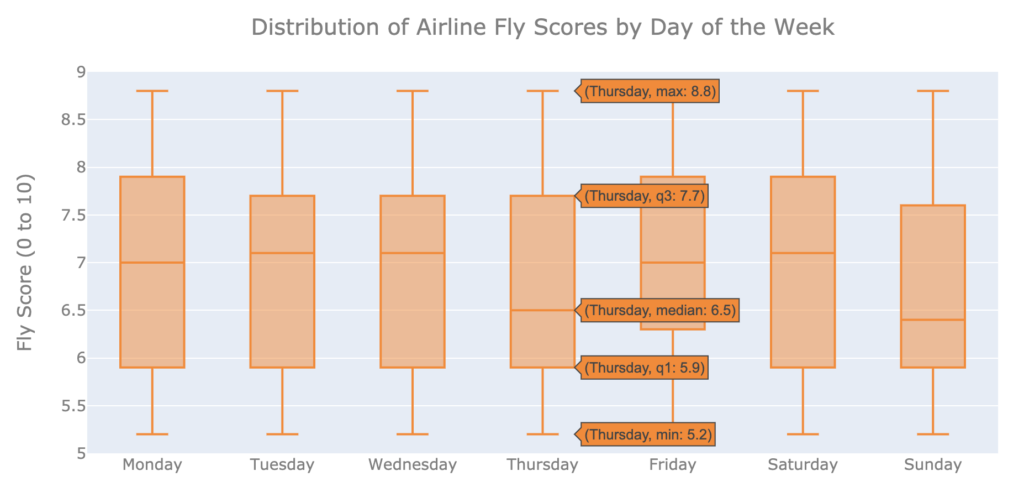
This is consistent with the distribution of flight prices previously shown where Thursdays and Sundays had the highest median flight prices. Therefore, based on prices and fly scores, Thursdays and Sundays are statistically the worst days to fly out of NYC because they have the highest median flight prices as well as the lowest median fly scores out of any given day of the week.
Flight Prices by Airline & Destination
Now that we've identified the best months and days of the week to purchase flights, let us consider how flight prices are distributed amongst our participating airlines.
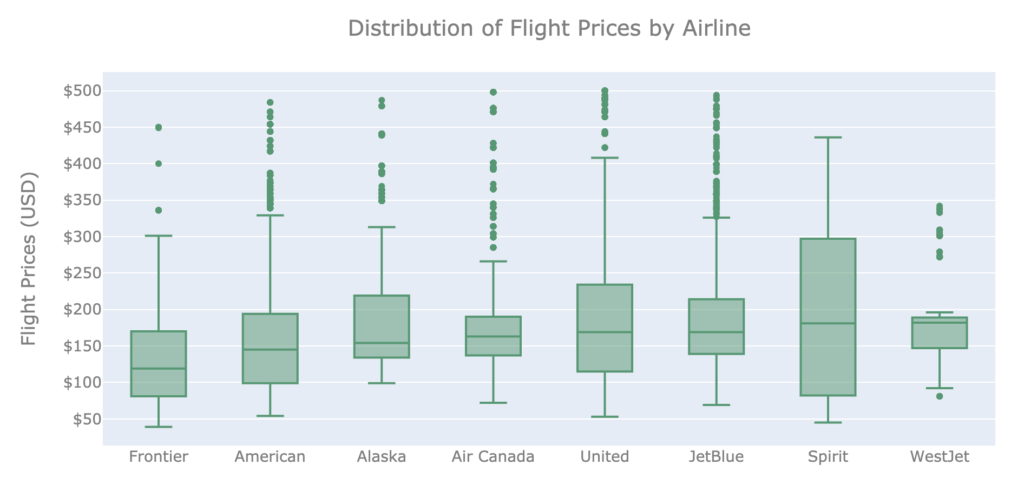
For all flights out of NYC for $500 or less, Frontier airlines had the lowest projected median flight price of $119 while WestJet had the highest projected median flight price of $182. Of course, this is an oversimplification since every airline shown above doesn't service every destination included in this dataset. As a result, this analysis is more useful when a single destination is chosen in order to equally compare the "best" and "worst" airlines.
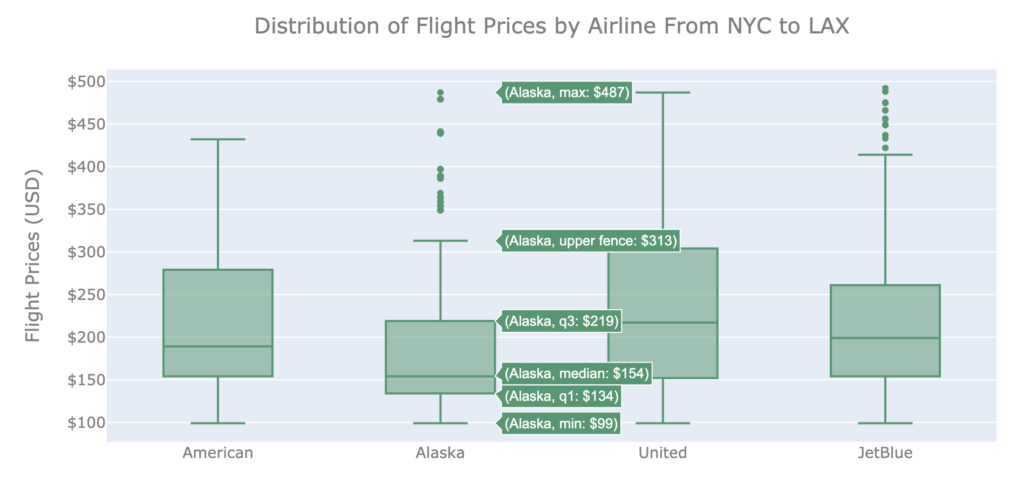
The example above shows the distribution of prices for all flights $500 or below, departing NYC and arriving in LAX. Here, there are only four airlines that service flights from NYC to LAX (American, Alaska, United, and JetBlue). Amongst these four airlines, Alaska airlines has the lowest projected median flight price of $154 while United airlines has the highest projected median flight price of $217. Therefore, if your desired destination is Los Angeles and you have a choice between these four airlines, then the cheapest overall option would be to fly with Alaska airlines.
Conclusion
Based on the core analyses I performed on this flight data scraped from Tripadvisor, my suggestion for consumers seeking the cheapest flights with the highest quality ratings is as follows:
- The best months to book flights are September and May
- The best days of the week to book flights are Tuesday and Wednesday
- The best airline to fly from NYC to LA is Alaska Airlines