Impact of Maternal Health on Infant Survival
View Demo AppContext
The Center for Disease Control (CDC) annually publishes material related to the birth rates and death rates of infants born in the United States. They gather a tremendous amount of data relevant to the child, including categories such as the education of the parents, age, health status, and tobacco use. Other categories include the health status of the new born, APGAR score, delivery method used, etc. There is countless material gathered for every child born in the United States. Due to the large volume of data available, it can be hard to keep track of it all. That being said, I dove right into this data in an attempt to uncover any interesting relationships between maternal health (i.e. mother's BMI and smoking habits) and subsequent infant natality and mortality rates.
Goal
The goal of this project was two-fold:
- To analyze and interpret the data collected from the CDC website on infant natality and mortality rates
- To develop a user-friendly application that aims to educate expecting mothers about the potential impacts their lifestyle choices may have on the health of their future child
Please follow along with my custom Shiny App as you peruse through the rest of this blog post.
Data Collection
All of the data used in this analysis was collected through the official CDC website, which includes:
- Infant Natality Data, 2016 - 2018
- Period Linked Infant Births & Deaths Data, 2016 - 2017
Since the original dataset from the CDC was fairly large (~ 3.8 million rows, 90+ variables per year of data), I built a custom parser in Python to only extract data that was relevant to our scope of work. Exploratory data analysis (EDA) was conducted in both Python and R while all of the plots were generated using R Plotly.
The main factors I considered include but are not limited to:
Maternal Demographics
- Age
- Race
- Education
Maternal Health & Lifestyle
- Body Mass Index (BMI)
- Pregnancy Risk Factors
- Bacterial Infections
- Tobacco Use
Infant Condition
- Gestation Period (weeks)
- Low Birth Weight
- APGAR Score
- Survival Upon Delivery
Once the data was cleansed of missing data values and irrelevant variables, I created several visualizations based on my analysis of the key factors listed above. Then, I built an interactive web application via R Shiny where expecting mothers or couples wishing to start a family can explore national statistics as well as customized statistics based on their own demographic, health conditions, and lifestyle choices.
Exploratory Analysis
Although it isn't the jolliest statistic, the infant mortality rate was the primary focus of this specific exploration. Fortunately, the death rate for infants born in the U.S. are relatively low compared to the rest of the world. However, the purpose of this section is to show future and expecting mothers how their lifestyle choices and overall physical condition may affect the survivability of their newborn child based on historical data. My intention is NOT to shame or instill fear into mothers but rather to encourage them to lead the healthiest lives possible in order to give their future child the best chance of survival.
Maternal Demographics
Age
One of the most important factors considering infant mortality rates is the age of the mother when she gave birth. The infant mortality rates were aggregated by the following age ranges:
- Under 15 years old
- 15 - 19 years old
- 20 - 24 years old
- 25 - 29 years old
- 30 - 34 years old
- 35 - 39 years old
- 40 - 44 years old
- 45 - 49 years old
- 50 - 54 years old
Based on the resulting distribution seen below, the three highest infant mortality rates were attributed to mothers between the ages of 45 to 49, 15 to 19, and 50 or older, respectively.

According to research conducted by the Mayo Clinic, older women (35 or above) are at a higher risk of developing gestational diabetes (diabetes that only occurs during pregnancy), high blood pressure, and experiencing pregnancy loss either via miscarriage or stillbirth, typically due to pre-existing medical conditions. Evidently, mothers between the age of 30 and 34 had the lowest infant mortality rate excluding adolescent/teenage mothers. However, as mothers reach the age of 35 and older, the infant mortality rates steadily increase eventually climaxing at 9 deaths per 1,000 births for mothers between 45 and 49 years old.
On the same accord, teenage mothers (teenagers or adolescents below 20) experience high infant mortality rates for some of the same reasons as older women as well as some other unique reasons. Pregnant teens are at a higher risk of developing gestational hypertension (high blood pressure) than pregnant women in their 20s and early 30s. They also have a higher risk of hyptertension eclampsia which is a dangerous medical condition that combines high blood pressure, swelling of a mother's hands and face, and organ damage. reasons than older women. These risks not only affect the pregnant teen but they can also disrupt the unborn baby's growth, leading to further pregnancy complications such as premature birth.
Furthermore, pregnant teens are at risk of not getting the proper prenatal care, especially if they don't have support from their parents. During the first months of pregnancy, prenatal care is critical because physicians are able to actively search for medical problems in both the baby and mother, monitor the baby's growth, and quickly deal with any complications that may arise. Physicians adminstering prenatal care can also prescribe vitamins with folic acid - ideally taken before getting pregnant - that are essential in preventing certain birth defects such as neural tube defects.
Although the exact causes plaguing these two populations of women are uncertain, there is enough historical data to see that women younger than 20 and older than 35 face above-average risks of complications during their pregnancies. As a result, mothers in these age groups should try to do everything in their power to maintain a healthy diet, avoid unnecessary stress, and stay emotionally stable for the sake of their child.
Race
The second demographic considered was the race of the mother giving birth. The infant death rates were aggregated by the following race groups:
- Black
- White
- Asian
- American Indian / Alaskan Native
- Native Hawaiian / Pacific Islander
- More Than One (Mixed)

It is important to note that in no way does a mother's race have any effect on the survival of their unborn child. However, I wanted to include this information because many studies suggest that there are certain health conditions that have affected specific populations and familes more than others. Therefore, this information is provided for mothers who desire to know these particular statistics solely for personal identification reasons and must not be used to make any discriminatory conclusions.
Education Level
The third demographic considered was the highest education level achieved by the mother. The infant death rates were aggregated according to the following education levels:
- 8th Grade or Less
- Some High School
- High School Diploma
- Some College
- Bachelor's Degree
- Master's Degree
- Doctorate Degree (PhD)
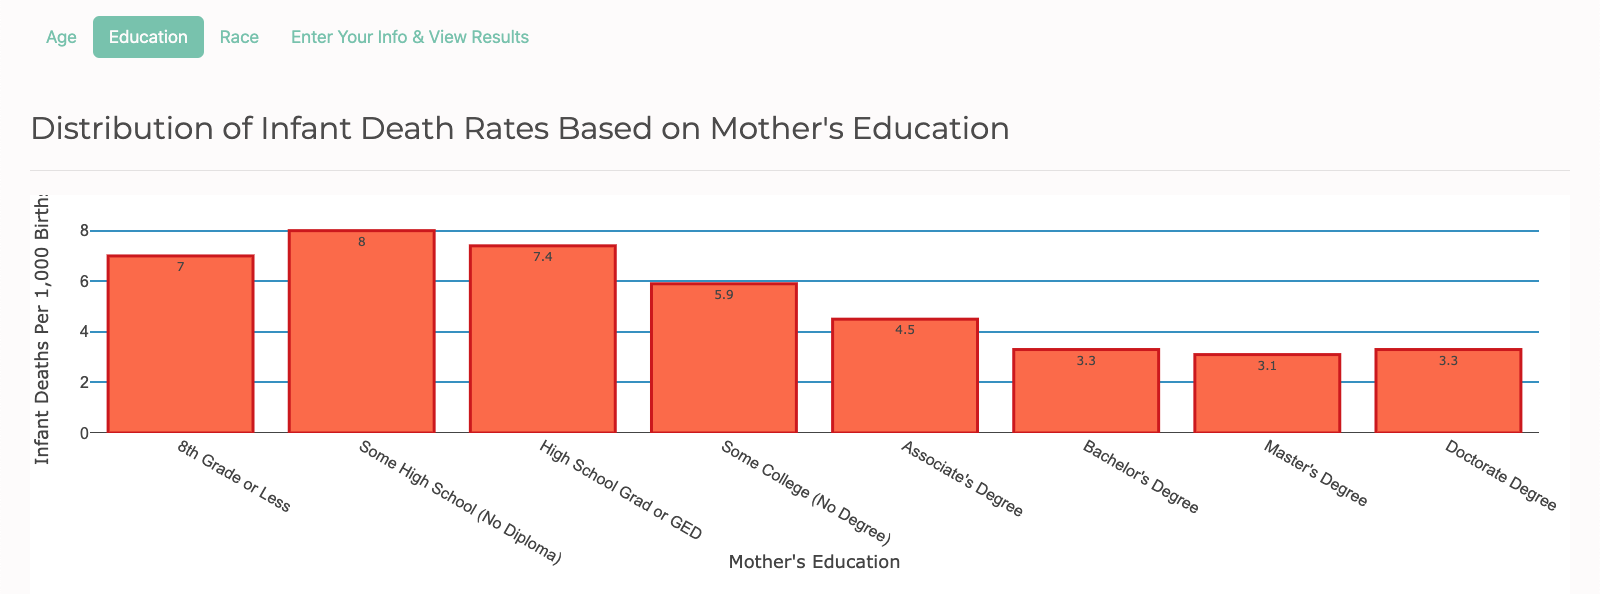
Again, as discussed above, it is important to note that in no way does a mother's racial background have any effect on the survival of their unborn child. This information is strictly provided for mothers who want to know these particular statistics for personal identification reasons and should not be used to make any discriminatory conclusions.
Maternal Health & Lifestyle
Research has shown that the health and lifestyle of a mother has a rather large impact on the health of a developing embryo/fetus. Though it is important for women to make healthy choices during their pregnancies, it is just as important for them to maintain a healthy lifestyle prepregnancy as well. Inherently, this makes sense as it is difficult for anyone (let alone pregnant women) to completely change their bad diets and habits on a whim, especially if they're already at risk or have developed chronic health problems due to poor lifestyle choices. On the flipside, women that are able to lead a healthy lifestyle PRIOR to becoming pregnant are likely to continue their good habits, putting their unborn children in the best possible position to avoid potential birth defects and other preventable outcomes.
Given the clear connection between mother and child, I wanted to highlight data showing the relationship between a mother's prepregnancy body size (represented by their BMI) and factors concerning the infant including premature births, low weight births, health within the first 5 and 10 minutes of being born, and whether the infant was reported dead or alive upon delivery. In addition, I compared the infant mortality rates for mothers with different smoking habits, mothers with and without some of the most common bacterial infections and risk factors specifically experienced during pregnancy.
Body Mass Index (BMI)
Body Mass Index (also known as BMI) is a robust indication of a person's overall health. BMI is calculated as a person's weight in kilograms divided by their height in meters squared (kg/m^2). The infant death rates were aggregated by the following BMI ranges:
- Underweight (BMI less than 18.5)
- Normal (BMI 18.5 - 24.9)
- Overweight (BMI 25.0 - 29.9)
- Obese Level 1 (BMI 30.0 - 34.9)
- Obese Level 2 (BMI 35.0 - 39.9)
- Extremely Obese (BMI 40.0 or greater)
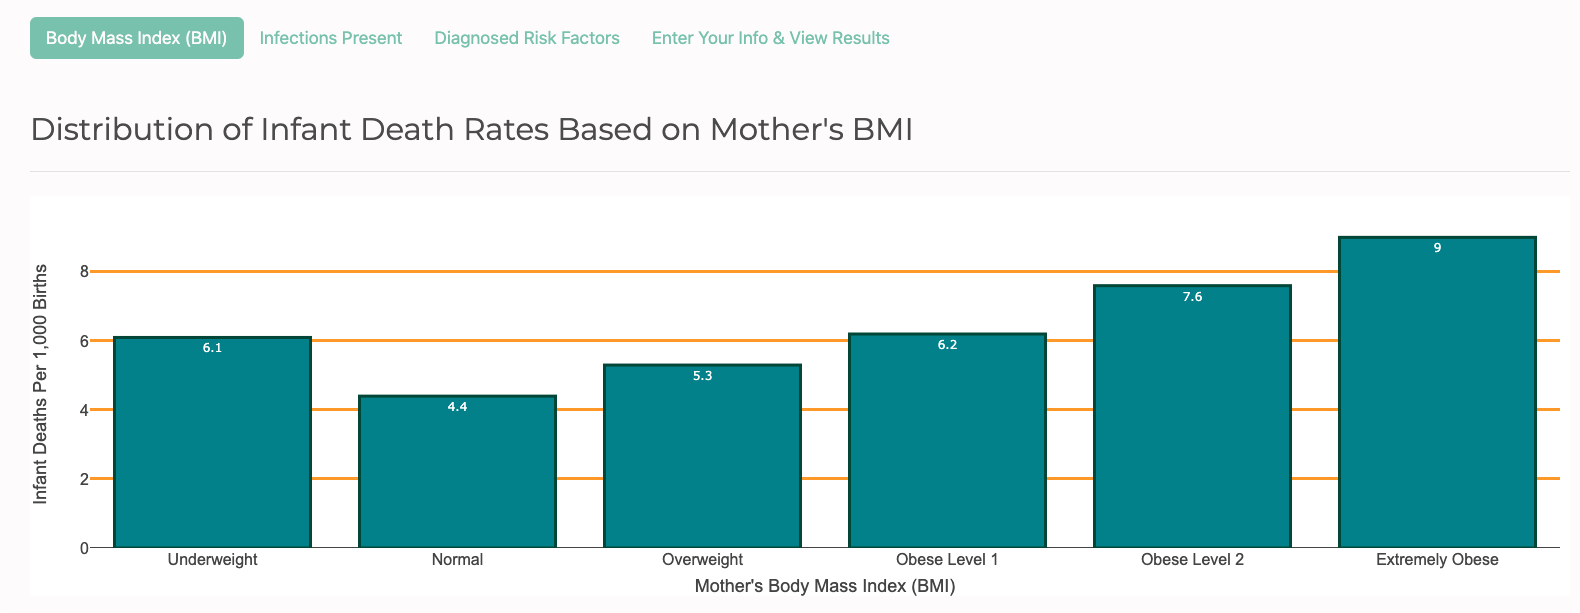
As expected, women in the Normal range had the lowest infant mortality rate at 4.4 deaths per 1,000 births while women in the Extremely Obese range experienced more than twice the rate of infant mortalities at 9 deaths per 1,000 births. Notice that women in the Underweight range experienced a higher rate of infant mortalities than those in the Overweight range. This plot suggests that it is statistically NOT advantageous to be underweight more so than it is to be overweight in this particular case. Instead, the optimal BMI range to be in is Normal because the infant mortality rate is shown to steadily increase alongside a woman's BMI.
Pregnancy Risk Factors
Listed below are 6 of the most common risk factors that women experience prior to and during pregnancy. It's important to keep in mind that women are more likely to suffer from these particular health risks when they are overweight because it suggests that their diets are unhealthy, making them more susceptible to develop diabetes or hypertension. Observe the infant mortality rates of mothers with and without these common risk factors.
- Pre-Pregnancy Diabetes
- Pre-Pregnancy Hypertension
- Gestational Diabetes
- Gestational Hypertension
- Hypertension Eclampsis
- Previous Preterm Birth
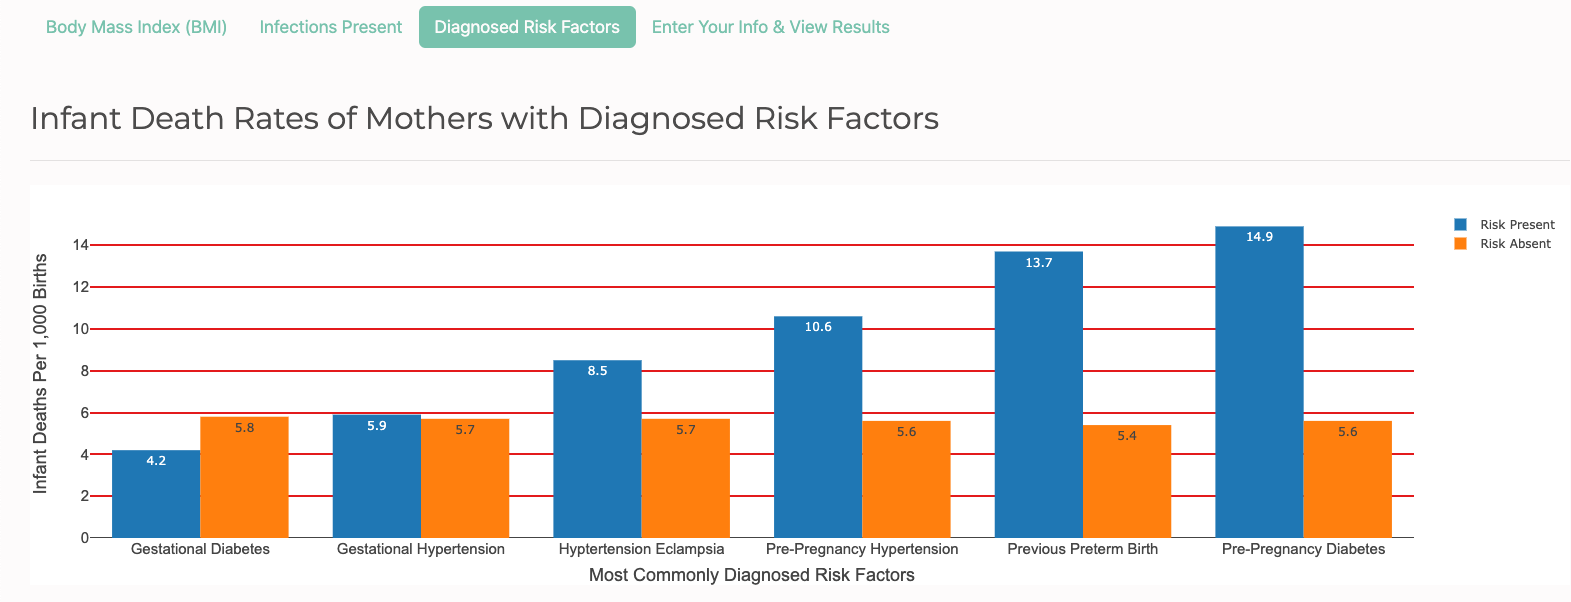
The gold bars represent mothers without these health risks and the blue bars represent mothers with them. At first glance, it's easy to see that mothers without the risk factors experienced relatively similar infant mortality rates, hovering anywhere between 5.4 to 5.8 deaths per 1,000 births. However, the same cannot be said for mothers with these risks present. With the exception of mothers with gestational diabetes, mothers with the other five health conditions had higher infant mortality rates than mothers without the risks.
Surprisingly, two of the top three infant mortality rates belonged to mothers with a prepregnancy condition. This reinforces the previous suggestion that mothers should try their best to avoid unhealthy diets and lifestyles prior to becoming pregnant because the data shows that a woman's condition prepregnancy is just as important - if not more important - than their health during their pregnancy.
Bacterial Infections
The bacterial infections listed below are mainly related to sexual health. The infant death rates were aggregated by the following bacterial infections:
- Hepatitis B
- Hepatitis C
- Chlamydia
- Gonorrhea
- Syphilis
Unlike the health risk factors discussed in the previous section, bacterial infections are not related to a person's weight or body size. However, they are related to how well a person practices proper sexual hygiene and protection prior to or during a pregnancy. In theory, these bacterial infections are entirely preventable but reality is far from it.
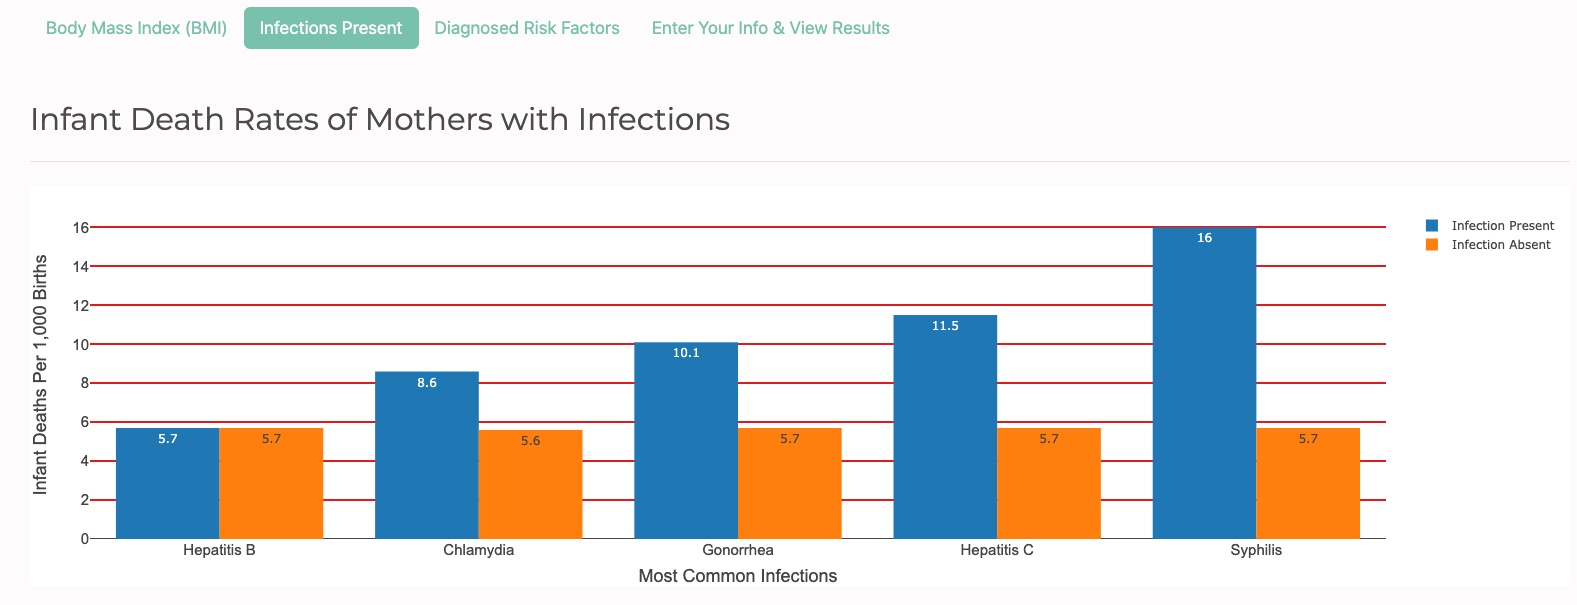
In similar fashion as the risk factors plot, the plot above shows that mothers without these bacterial infections experienced relatively similar infant mortality rates ranging anywhere between 5.6 - 5.7 deaths per 1,000 births. On the otherhand, mothers with these infections present experienced infant mortality rates greater than or equal to their counterparts. Specifically, mothers with Syphilis and Hepatitis C had more than double the rate of infant deaths than mothers without those specific infections. Meanwhile, mothers with and without Hepatitis B had the exact same infant death rates, signifying that Hep B doesn't necessarily put mothers who have it at a higher risk of having their unborn child die than mothers who don't have it.
Tobacco Use
According to the Center for Disease Control (CDC), smoking during pregnancy increases the risk of health problems for developing babies, including preterm birth, low birth weight, and birth defects of the mouth and lips. Smoking during and after pregnancy also increases the risk of sudden infant death syndrome (SIDS). Both babies whose mothers smoke while pregnant and babies who are exposed to secondhand smoke after birth are more likely to die from SIDS than babies who are not exposed to cigarette smoke. Studies also suggest a relationship between tobacco and miscarriage. Carbon monoxide in tobacco smoke can keep the developing baby from getting enough oxygen. Tobacco smoke also contains other chemicals that can harm unborn babies.
E-cigarettes and other tobacco products containing nicotine (the addictive drug found in tobacco products) are also unsafe to use during pregnancy. Nicotine is a serious health danger for pregnant women and developing babies and causes severe tissue damage to an infant's vital organs, mainly the brain and lungs.
The infant mortality rates were aggregated by when mothers used tobacco (if any) and the number of cigarette packs they smoked daily:
- Pre-Pregnancy
- First Trimester
- Second Trimester
- Third Trimester
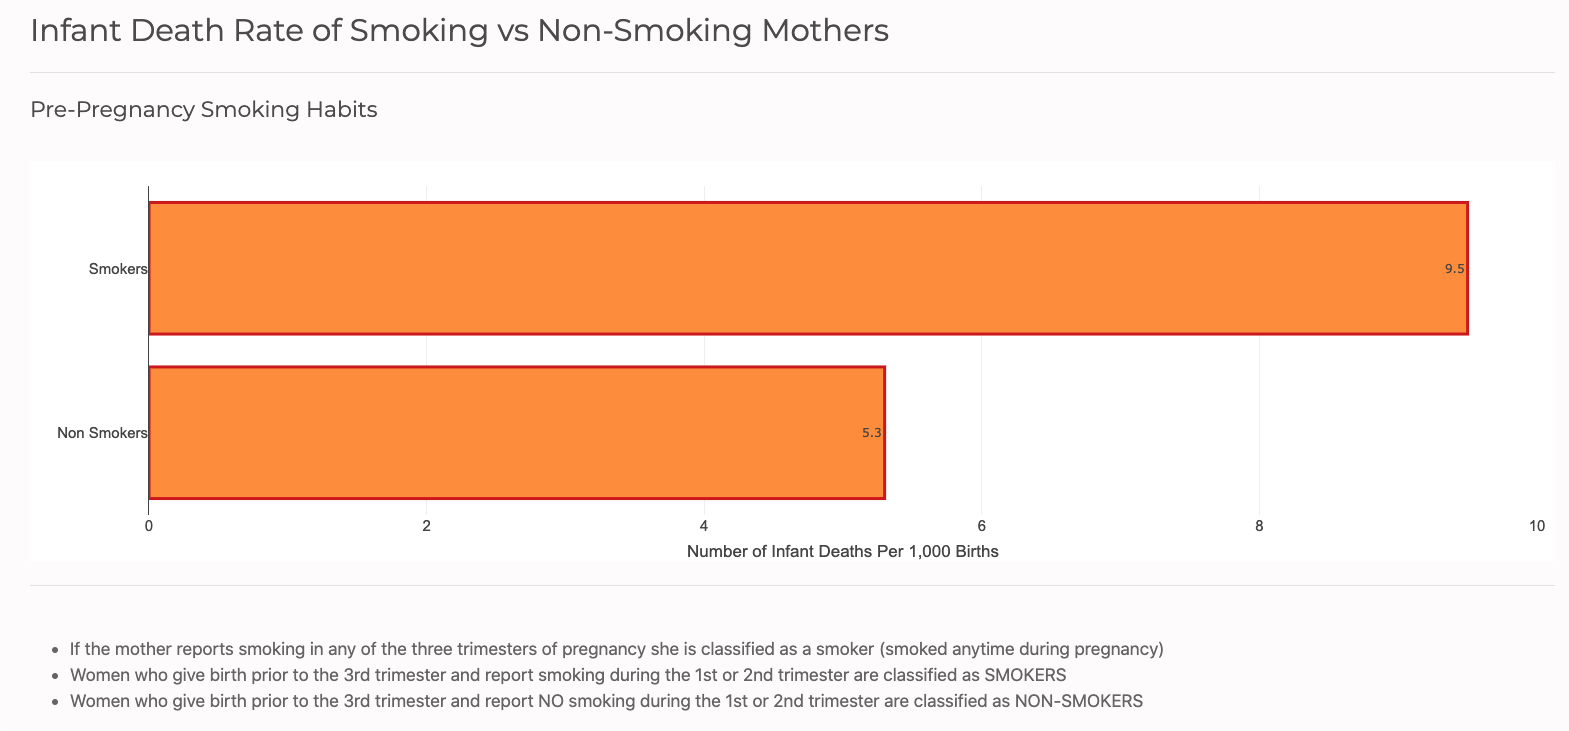
The plot above compares the infant mortality rates of mothers who smoked vs. mothers who didn't smoke leading up to their pregnancy. Notice that the infant death rate for mothers who smoke is nearly twice as high as mothers who don't smoke. Given the negative impacts of smoking tobacco while pregnant, it's understandable that smoking leading up to a pregnancy is also unsafe for the health of the mother and especially their unborn babies.
Subsequently, for women who smoke during pregnancy, the infant death rates only get worse as mothers continue to smoke into the later months of their pregnancies. The plot below compares the infant mortality rates of mothers who didn't smoke, mothers who smoked 1 pack or less daily, and mothers who smoke more than 1 pack daily during each individual trimester.
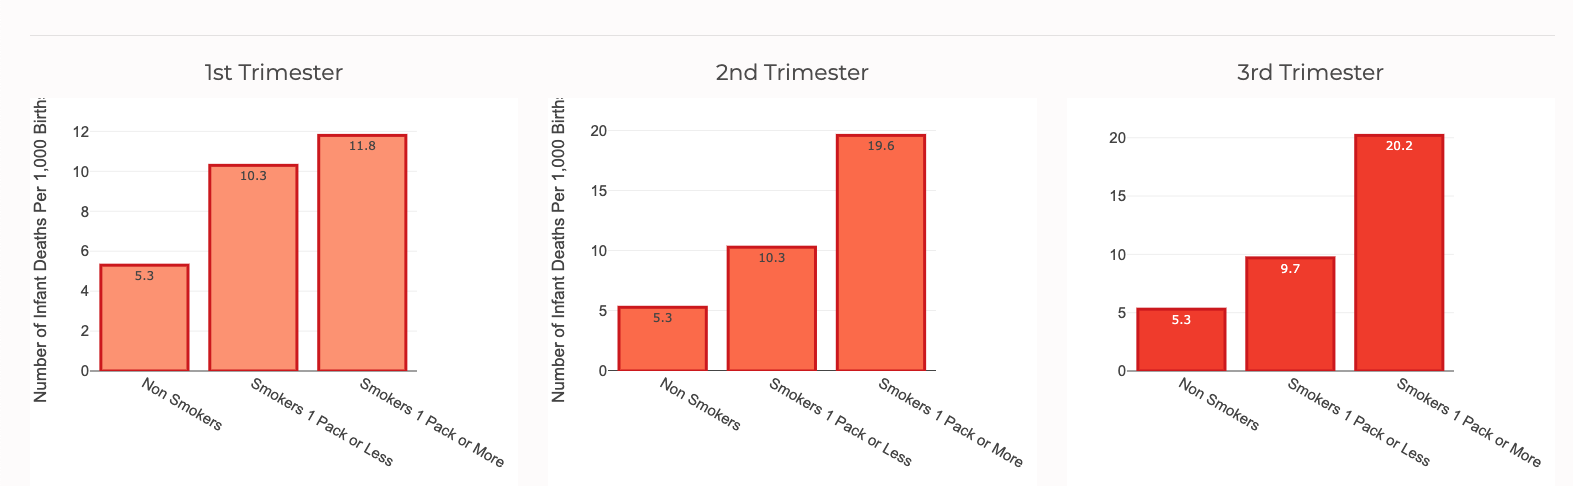
Non-smoking mothers as a whole have an infant death rate of 5.3 deaths per 1,000 births. However, as the pregnancy progresses from the first trimester to the third trimester, the infant mortality rates for both women who smoke 1 pack or less and women who smoke more than 1 pack a day are significantly higher than their non-smoking counterparts. One alarming finding is that women who smoked during the third trimester of pregnancy experienced nearly quadruple the rate of infant deaths than women who don't smoke.
Alongside causing suddent infant death syndrome, smoking tobacco during pregnancy can also lead to low birth weight infants which decreases the overall likelihood that the baby will be able to live a healthy life let alone survive. As shown below, out of all non-smoking mothers who gave birth in the U.S. in 2017, 8% of infants were born as low birth weights. Unsurprisingly, 15% of smoking mothers had a low birth weight child, more than double the amount of low birth babies non-smoking mothers gave birth to.

Infant Condition
The CDC defines survival as infants who live 365 days (1 calendar year) or more. As a result, the condition of an infant is a critical aspect to consider when investigating whether or not that child will live past their first birthday. Specifically, I looked at four variables related to the infants' conditions and the association they had with the mother's BMI. The variables include the gestation period, low birth weight, APGAR Score, and survival upon delivery.
Gestation Period (weeks)
Gestation is defined as the period of development during the carrying of an embryo or fetus inside a human being. Gestation periods are most commonly measured in weeks. Normal gestation is typically between 38 - 40 weeks and anything below 37 weeks is considered a preterm birth which can be detrimental to an infant's health both short and long term. As stated previously, an unhealthily high maternal BMI is strongly linked to serious risk factors like diabetes and hypertension. To reinforce this claim, I studied the relationship between maternal BMI and infant gestation period. Specifically, I calculated the average BMI of mothers based on the total gestation period of their child.
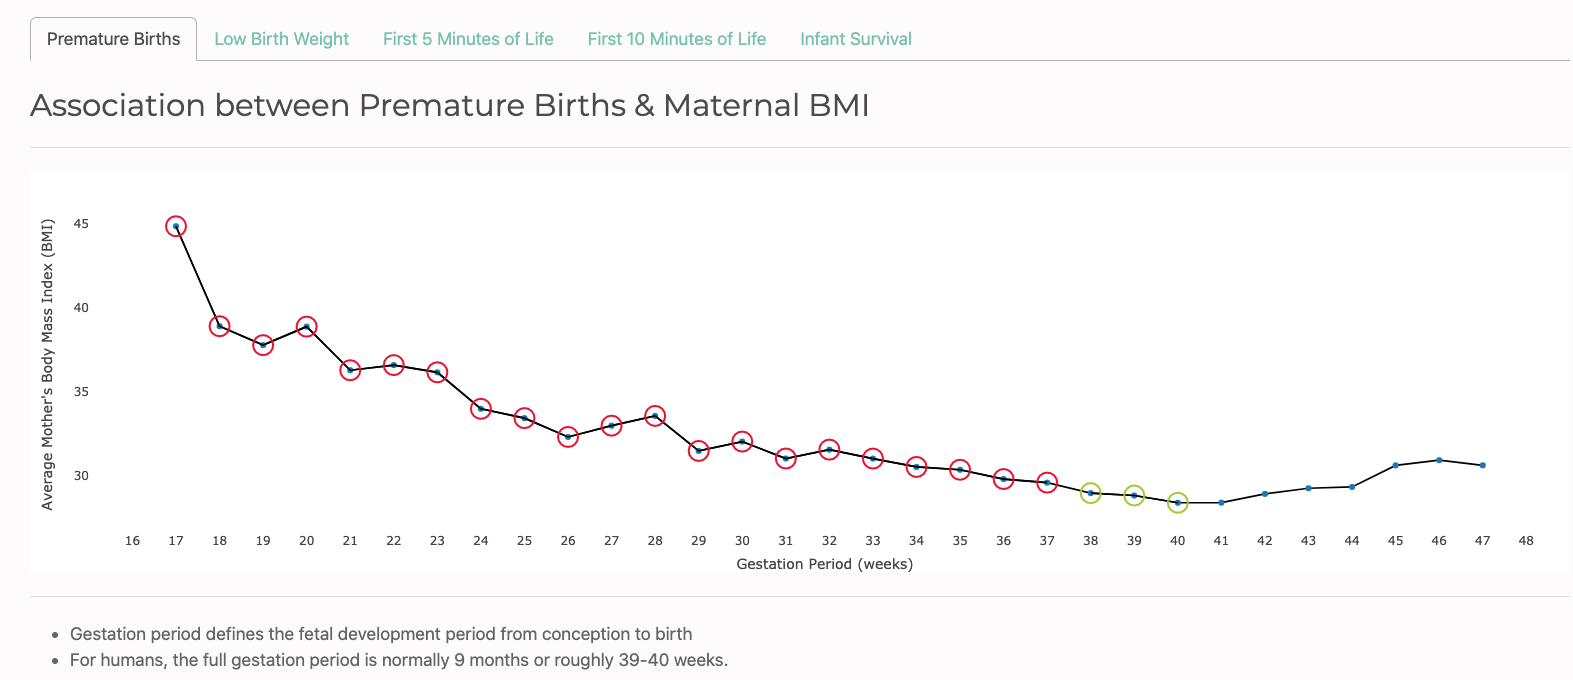
Generally speaking, the average BMI of mothers trends downwards as the total gestation periods of infants progresses from 17 weeks to 40 weeks. Evidently, the mothers of infants born prematurely at 17 weeks had an average BMI of about 45 which falls in the Extremely Obese category. Meanwhile, the mothers of infants born in the optimal period between 38 and 40 weeks were amongst the lowest in terms of average BMI all hovering below a BMI of 30 which is considered Overweight. Therefore, mothers who maintain a prepregnancy BMI as close to the Normal range as possible are maximizing the chances of their children being born as close to the optimal gestation period as well.
Low Birth Weight
As previously discussed in the Tobacco section, the birth weight of an infant is a robust indicator of how healthy they are and ultimately how likely they are to survive. Keep in mind the CDC defines low birth weight as infants that are born weighing 2,500 grams or less. The lower the birth weight of a baby, the lower the chances they have of surviving due to their underdeveloped organs and body.
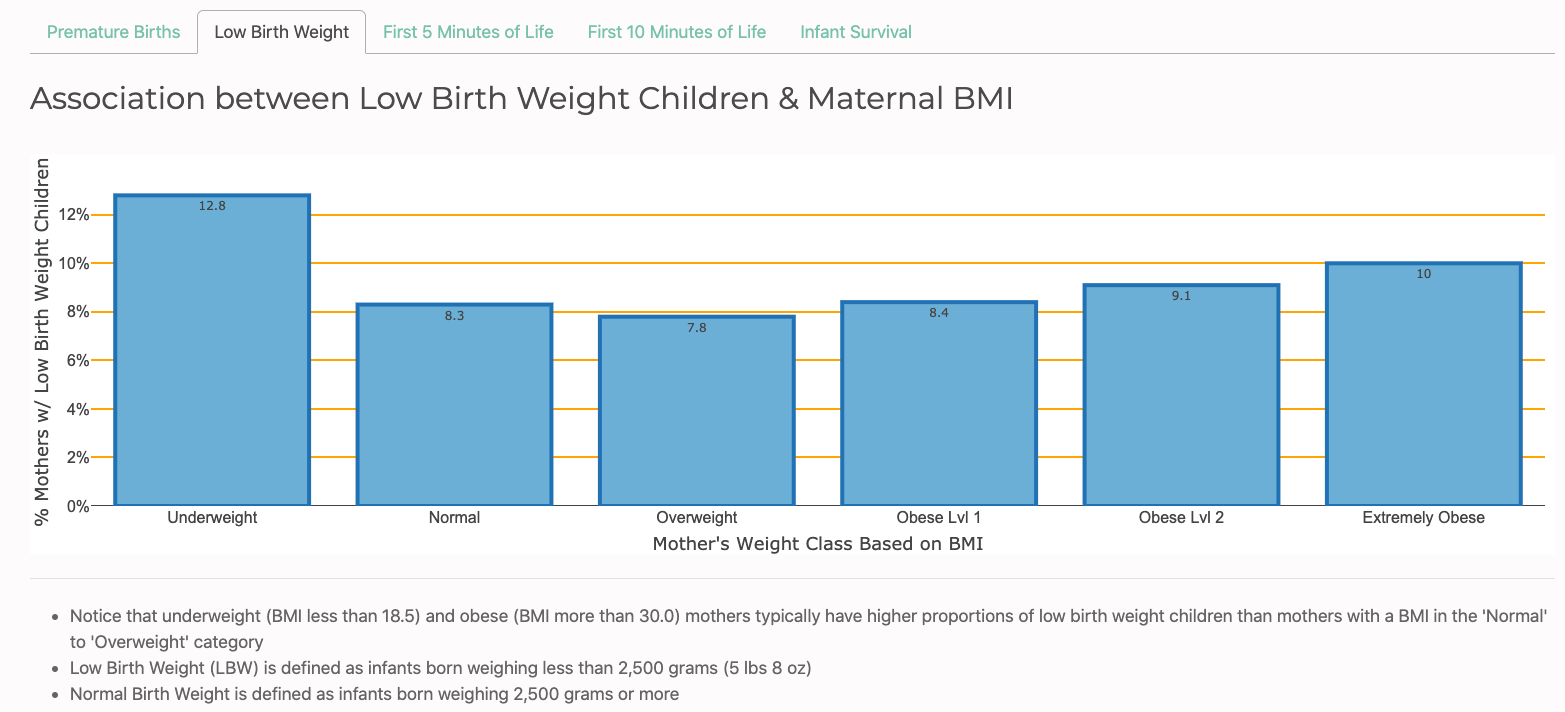
Given this knowledge, I calculated the perentage of mothers with low birth weight children categorized by their respective BMI ranges. Surprisingly, mothers in the Overweight BMI range had the lowest percentage of low birth weight babies at 7.8% followed by mothers in the Normal BMI range at 8.3%. On the other side of the spectrum, the results are also not exactly what we would predict. Mothers in the Extremely Obese BMI range had the second highest percentage of low birth weight babies breaking double digits at 10%. But most suprisingly, mothers in the Underweight BMI range had the highest percentage of low birth weight babies at a whopping 12.8%.
APGAR Score
APGAR is an acronym for Appearance, Pulse, Grimace, Activity, and Respiration. The APGAR test is adminstered by a doctor, nurse, or midwife. An infant is given a score between 0 and 10 based on their skin color, reflexes, muscle tone, heart rate, and breathing effort.
Each category is scored as follows:
| Category | Condition | Score Range |
|---|---|---|
Skin Color |
|
|
Reflexes |
|
|
Muscle Tone |
|
|
Heart Rate |
|
|
Breathing Effort |
|
|
The 5-minute and 10-minute APGAR scores determine how well the baby tolerated the birthing process and also tells the healthcare provider how well the baby is doing outside of the mother's womb.
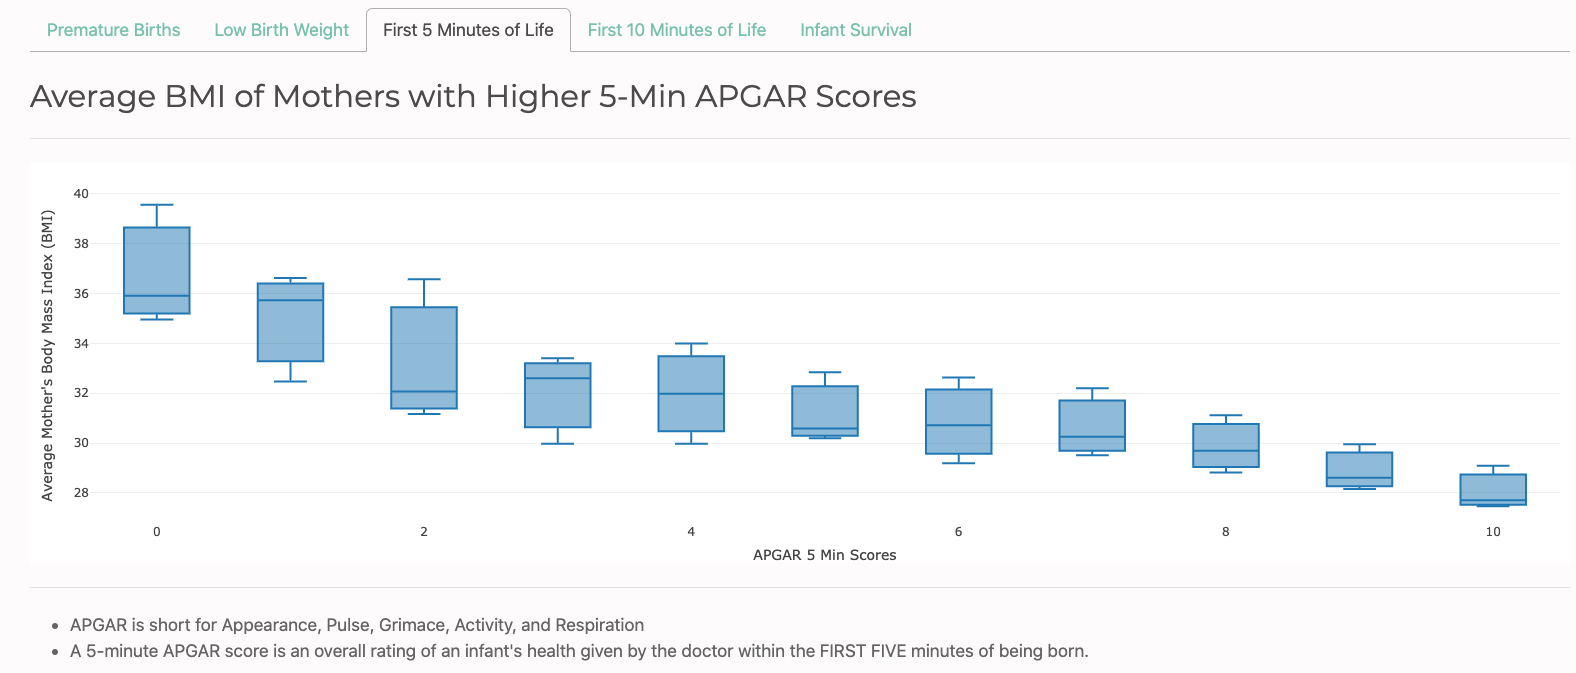
The boxplots distributions above and below show the relationshiop between maternal BMI and the APGAR scores their children received. Both distributions reflect a similar downward trend of the median maternal BMI as the APGAR score of the infant increases.
In the 5-minute test, the median BMI of mothers with infants that had an overall score of 0 was slightly under 36 while the median BMI of mothers with infants that had an overall score of 10 was slightly under 28. Similarly, the 10-minute test shows the same steady decline of median maternal BMI as the APGAR scores increase from 0 to 10.
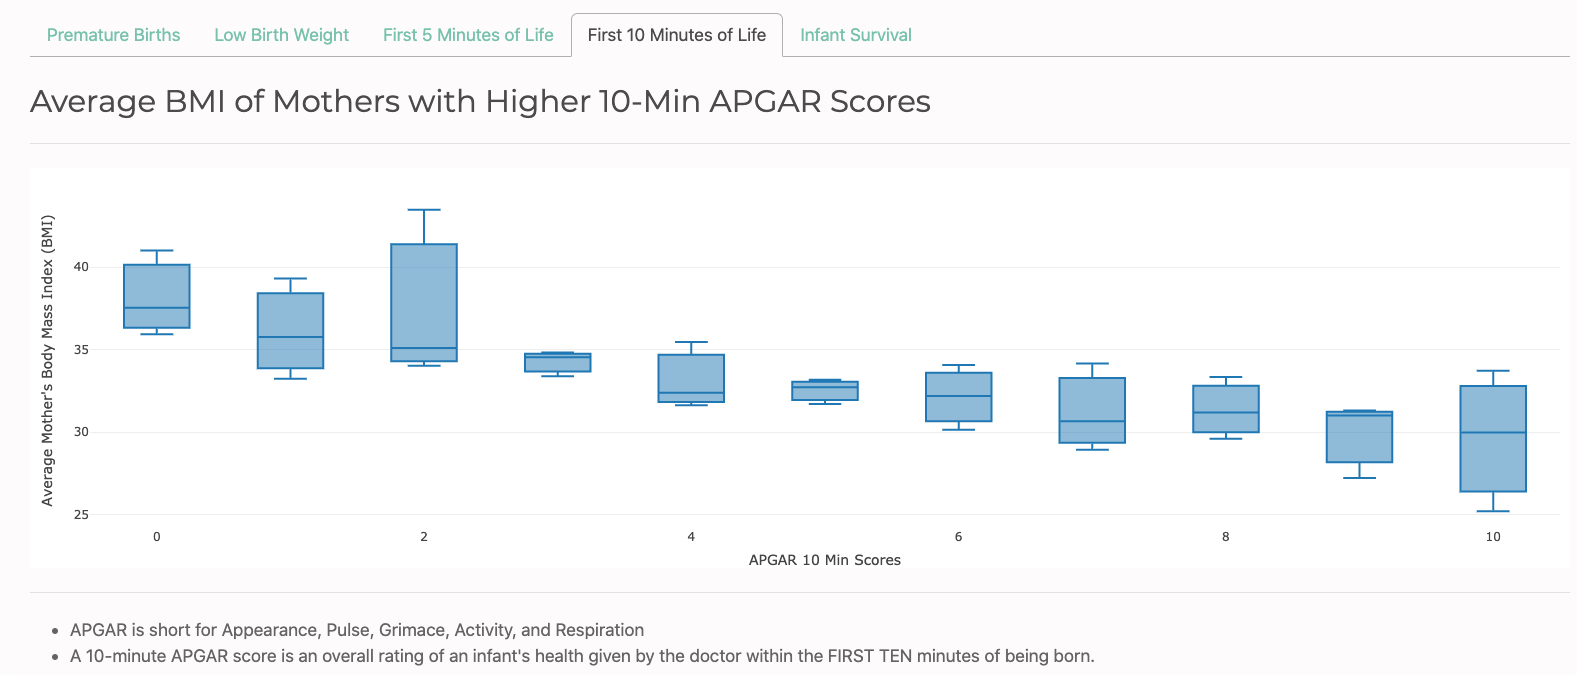
Both the 5-minute and 10-minute plots reinforce the notion that the infants of women who maintain a BMI as close to the Normal range as possible receive higher APGAR scores than infants of mothers who are further away from the Normal BMI range.
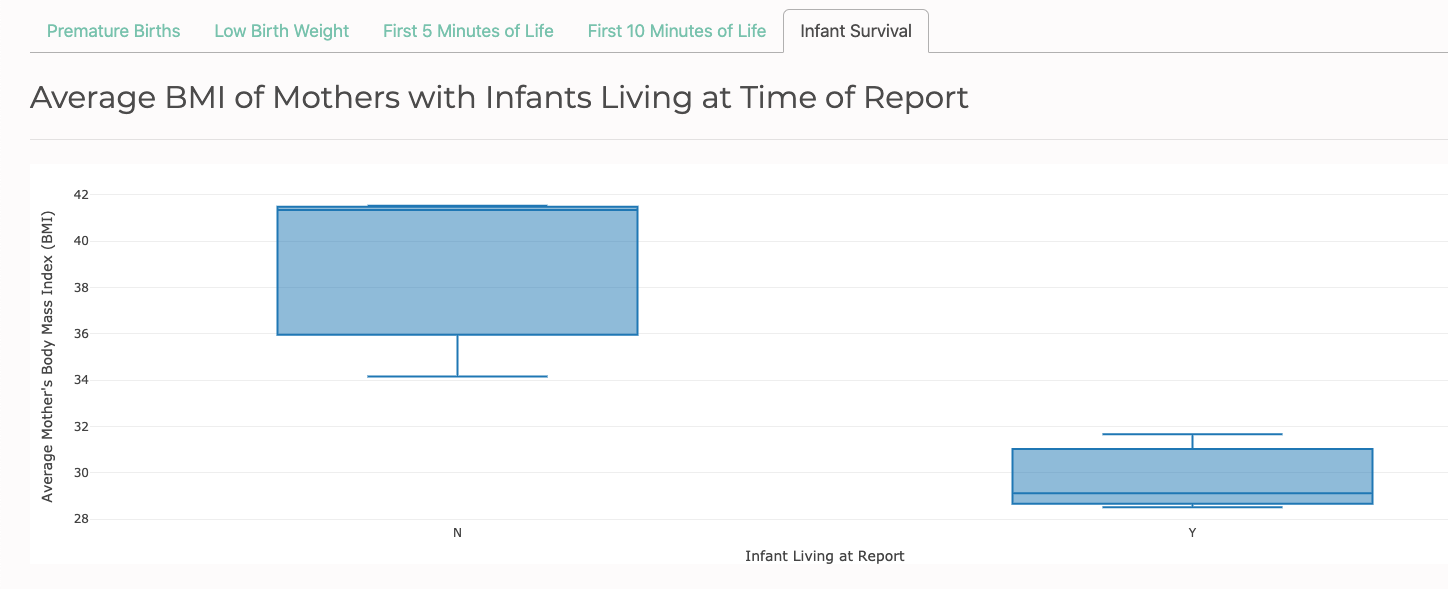
Survival Upon Delivery
Last but not least, I investigated the relationship between a mother's BMI and whether the infant was pronounced dead or alive upon delivery. According to the 2017 CDC data visualized below, approximately half of all deceased infants had a mother with a BMI between 36 - 41 while roughly half of all living infants had a mother with a BMI between 28.5 - 31. Moreover, there is no overlap between the distributions. The highest BMI value for mothers with a living infant was slighly under 32, but the lowest BMI value for mothers with a deceased infant was approximately 34.
Conclusion
The mission of this project was to analyze the impact that a mother's health and lifestyle choices have on the overall survival of their developing child. I started with general demographics such as maternal age, race, and education then progressed to more specific factors like body mass index (BMI), pregnancy risk factors, bacterial infections, and tobacco use. Finally, we took a deeper look at how maternal BMI itself has the potential to have a significant impact on the condition of a child and their overall likelihood to survive birth. Given the findings laid out in the Analysis portion of this project, there is compelling evidence that mothers who maintain a healthy BMI range, take care of their sexual health & hygiene, and avoid the use of tobacco products even before becoming pregnant generally experience lower infant death rates.